 Bank savings account.
- Investors who want keep the possibility to quickly withdraw a limited amount
of cash usually make a deposit in a bank savings account
(for example, check
UBS,
Handelsbanken,
Deutsche Bank). Depending on the total amount invested and the seasonal
variations in the interest rates, deposits are rewarded with 0-2%
interest excluding fees and taxes.
The bank will of course invest the money further for its own profit,
but tough regulations ensure that the risk of a bank defaulting on
savings account is tiny and the governments often protect deposits
to an upper limit around EUR 50,000.
 Bank certificates of deposit.
- Investors willing to lock up their money for a couple of years until a
certificate of deposit reaches the
maturity date
can expect larger returns around 3-5%
(for example, check
UBS).
For this first type of longer term investment, it becomes important to
distinguish the simply compounded annual percentage rate (APR)
from the discretely compounded annual percentage yield (APY) that
includes the interest on interest rates.
Masters: simple, discrete and continuous compounding of interest rates
Consider an amount A
invested for an annual interest rate R during n
years. If the money earned once a year is not reinvested, the terminal value
from a simply compounded calculation leads to
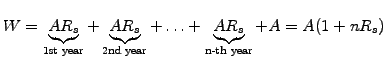 |
(1.3#eq.1) |
If the money is compounded m
times a year and immediately re-invested at the same rate, the terminal
value from a discretely compounded calculation becomes
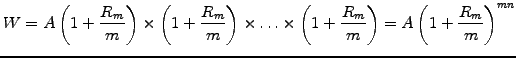 |
(1.3#eq.2) |
Increasing the compounding frequency to infinity mܥ,
the terminal value from the continuously compounded calculation
tends to
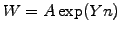 |
(1.3#eq.3) |
where the yield Y
can be understood as the annual growth rate of the investment.
Continuous compounding is often used for simplicity instead of the more
realistic discrete compounding; both are in any case simply connected via
![$\displaystyle R_m=m(\exp[Y/m]-1), \hspace{1cm} R=\exp[Y]-1$](s1img51.gif) |
(1.3#eq.4) |
where Rm is the discretely and R
the continuously compounded annual rate.
For example, take a 1% monthly rate of a unit investment:
depending on the compounding, this translates into WAPR=1.01 x 12=1.12, WAPY=1.0112=1.126825,
which approaches the continuous annual value of W=exp(0.01 x 12)=1.1275.
In other words, the return has an APR of 12% and an APY of 12.68%.
Brokerage houses often insure a single certificate of deposit for up
to EUR 500,000. The main disadvantage of a certificate of deposit is
that it locks up the money for a long time unless a steep penalty is
payed... up to half of the return from the interest rate!
-
Money market funds.
- With similar interest rates, around 3-5%, and no maturity constraints,
money market funds are only slightly more risky
(for example, check
CS First Boston,
SEB,
Credit Lyonnais). A fund manager collects money from a pool of investors and distributes
it into a large number of bonds to spread out
the risk of defaulting on a debt. Good managers will pick bonds with high
return to risk ratios, for a managing commission of up to one fifth of the
fund's return, which is directly deducted from the investors profit.
Specialists argue that no money market fund has ``broken the buck'' (i.e.
returned less than the original investment) in the last 15 years; it is
not easy to verify even such a strong statement, but our readers from
around the world may want to comment in our
World Forum.
-
Mutual and hedge funds.
- By combining holdings in cash, bonds and
stock, fund managers can produce larger
returns with an increased amount of risk.
Every day, the manager counts up the value of all the fund's holdings
and, by dividing by the number of shares that have been purchased by
the investors, calculates the
Net Asset Value (NAV) per share of that fund.
New investors send their money to the fund manager, who will issue
new shares from that fund for the latest quoted value. Holdings are
continuously sold and reinvested, which is why mutual funds are
sometimes called open-end funds.
If the fund manager is doing a good job, the net asset value increases
and the investors make a profit when they eventually sell their shares.
Nevertheless, management commission of around 1-2% of the NAV eat
away a considerable fraction of the average 5-10% growth that can be
expected in the long term.
A large variety of funds pursue different investment strategies
(countries, industries, risk levels, ethical factors): on Feb 23, 2002,
the
Financial Times
newspaper listed more than seven pages with funds... more than shares!
In this context, it is good to remember that market indices (such as
FTSE-100,
Russel 1000,
NASDAQ-100)
are by definition an arithmetic average; since funds now represent a
larger fraction of the market, it is clear that roughly half of the
funds under-perform that index.
Pursuing a variety of often contradicting strategies can nevertheless
be exploited by the marketing departments of the management firms,
who simply highlight even few funds that outperformed the index to
advertise the skills of all the managers.
 Bonds.
- Investors aiming for the 5.2% long term average return produced by
the US bond market have to minimize the fees and commissions payed
in transaction coses to the managers... but then have to manage the
investment risk by themselves.
As a matter of fact, individuals can lend money both to the government
and to corporations: both borrow capital from the public by issuing
bonds and other
fixed income instruments
that are traded on the
bond markets.
The price of a bond evolves from its initial
nominal principal or
face value
and the issuer pays a regular predetermined amount of cash called
coupon until the bond reaches the
maturity or
redemption date, when the principal
is finally payed back to the investor.
Masters: fixed stream of payments of a bond / discount factor.
Throughout its life, a bond generates a predetermined stream of payments
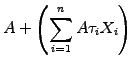 |
(1.3#eq.5) |
where the amount A is the principal value outstanding at maturity (usually
normalized to 1 or 100),  is the tenor
or the frequency (in fractions of years, e.g. 30/360 for a monthly coupon
in the LIBOR convention) and
is the tenor
or the frequency (in fractions of years, e.g. 30/360 for a monthly coupon
in the LIBOR convention) and  the
fixed annual interest rate used to
calculate the coupon per unit investment (e.g. 0.05 for a 5% coupon).
the
fixed annual interest rate used to
calculate the coupon per unit investment (e.g. 0.05 for a 5% coupon).
As the name suggests, a zero-coupon bond
does not pay any coupon and simply returns the contractual value AP(T,T)=A
on the maturity date T. Its present value AP(t,T) measured at time
t<T can be calculated from a
no-arbitrage argument, provided that
the interest rates are fixed and that the issuer is certain to pay the
loan back on time.
Indeed, investing an equivalent amount of cash on the money market for a
yield Y should result in the same final value as when the bond matures;
if this were not true and the price lower (alt. higher), it would be
possible to buy (alt. sell) bonds in exchange of cash on the money
market and generate a risk-free profit at the maturity date.
Arbitrageurs would immediately take advantage of such opportunities until
the demand (alt. offer) moves the price back to the equilibrium value
![$\displaystyle P(t,T)\exp(Y[T-t]) = P(T,T) = 1$](s1img55.gif) |
|
|
|
![$\displaystyle \Rightarrow P(t,T)=e^{-Y[T-t]}$](s1img56.gif) |
|
|
(1.3#eq.6) |
In a risk-free economy, the present value of an asset can always be
calculated from a price known in the future by multiplication by the
discount factor
![$ \exp(-Y[T-t])$](s1img57.gif) .
This is also true for coupons payed at
.
This is also true for coupons payed at
 ,
which can be discounted back in time as
,
which can be discounted back in time as
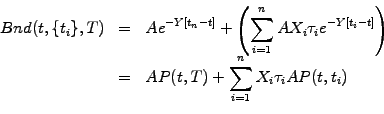 |
(1.3#eq.7) |
showing that the present value of a coupon-bearing instrument
can always be reduced to a linear combination of zero-coupon bonds
(exercise 1.07).
In the real world, the spot price of a bond is determined by the offer
and demand from investors and depends also on the credit worthiness of
the issuer. Rating agencies such as
Standard & Poor,
Moody's
or
KMV
use different criteria to judge issuers who are labeled from the safest
``investment grade'' (AAA, AA, A, BBB, of which 2.95% American corporate
bonds defaulted in 2002)
down to ``speculative'' (BB, B, CCC, CC), ``junk'' or ``default'' (C,D).
The price of a bond drops sharply when the risk of defaulting on a debt
rises: check the historical value of the
Argentinian government bonds
as its credit worthiness was finally downgraded from C to D in December 2001.
The spot price quoted for a variety of bonds can be accessed with
a dozen minutes delay free of charge over the Internet (take e.g.
Yahoo,
Bloomberg, etc)
and the closing prices are reported one day later in the press:
for example, on Feb 23, 2002, the
Financial Times
printed the values in 1.3#tab.1.
Table 1.3#tab.1:
Bonds traded in London quoted on Feb 23, 2002 by the press
|
Issuer |
Red date |
Coupon |
S&P rating |
Bid Price |
Bid Yield |
|
Sweden |
01/09 |
5.000 |
AA+ |
100.154 |
4.97 |
|
Ford |
06/10 |
7.875 |
BBB |
102.241 |
7.50 |
|
Marconi |
03/10 |
6.375 |
B+ |
35.000 |
26.73 |
|
The first row shows a Swedish government bond that matures Jan 2009
and pays a 5% annual coupon: with a good investment grade AA+ and
a yield in line with the market's expectations, the price (given as
a percentage of the principal value of EUR 1,000) is 0.154% higher
than the principal. If you bought this bond on Feb 22, you would now
earn 0.03% less than the original coupon.
Marconi's corporate bond expires March 2010 and pays a coupon of 6.375%;
after the downgrade of telecom operators and speculations about the
company's financial fitness, the coupon is now well below what the
market expects for the speculative B+ rating.
This explains why the bond lost 65% of its principal value and was
now only worth 35.00. If you bought this bond on Feb 22, you could
earn a very high yield of 26.73% during the next 10 years, provided
that the company does not go bankrupt in the mean time.
Small systematic costs have a large impact on the long term return of
a portfolio: investors should never neglect the possibility of tax
reductions or outright exemptions when buying municipal, state or
government bonds.
-
Stock.
- Encouraged by the average 7-11% long term average growth of the stock
market, investors often add company shares to their portfolio.
By doing so, they become co-owners and link the fate of their investment
to the future earnings of these companies.
Every quarter of a year, the management appointed by the shareholders
assembly reports on the profits or losses and sometimes distributes a
fixed dividend for every share to
reward the investors.
In many countries, the tax on dividend income is higher than the tax on
the gain in capital - although recent modifications of the taxation in
the US may revert this trend. Shareholders therefore prefer to keep
the dividend yield low and let the value of shares grow with the
company as long as growth remains possible.
The valuation of the company's assets, together with the latest results
and the expectation of future earnings directly impact on the offer and
demand from investors on the stock market
(such as
NYSE,
NASDAQ) which ultimately determines the price of shares.
The spot prices quoted for every share can be read free of charge
on the Internet after only a dozen minutes delay (take e.g.
Yahoo,
Bloomberg,
etc) and the closing prices are reported one day later in the press:
for example, on Feb 23, 2002, the
Financial Times
printed the values in 1.3#tab.2 below.
Table 1.3#tab.2:
Stocks traded in London quoted on Feb 23, 2002 by the press
|
Company |
Price |
+/- |
High |
Low |
Volume |
Yield |
P/E |
|
Hilton |
215 1/2 |
-4 3/4 |
259 3/4 |
152 |
8,081 |
4.0 |
11.9 |
|
AstraZeneca |
3519 |
+64 |
3564 |
2724 |
3,874 |
1.4 |
29.9 |
|
Marconi |
16 3/4 |
-2 3/4 |
800 |
12 1/4 |
103,986 |
- |
- |
|
The first row shows that the share from Hilton hotels fell GBP 4.75 to
215.50, in a liquid market with more than 8 million shares exchanged
during the trading day. This price is somewhere in the middle of the
range over which the share was trading during the last 12 months, as
indicated by the high and low ends of the price interval.
The price-to-earning ratio shows that it approximatively takes P/E=11.9
years for the company earnings to add up to the original purchase price
(``paying back your investment'') if the earnings remain fixed.
Assuming a small one percent growth G=0.01 for a mature industry, you
can show (exercise 1.06) that this corresponds to an expected return
on investment of G+E/P=0.01 +1/11.9=0.094
or 9.4%, which is indeed much larger than the 4% dividend yield payed
in cash to the shareholders; investors should therefore expect Hilton's
share price to rise by an annual 5.4%.
AstraZenca pharmaceuticals have been growing very fast during the last
years and, expecting that this will continue into the future, investors
are willing to pay a much larger price-to-earning ratio of 29.9.
For the sake of simplicity, assume that the exponential growth reached
from the Low to the quoted Price during exactly one year, so that the
growth rate can be estimated from G=ln(P2/P1)/(t2-t1)=ln(3519/2724)=0.25.
This translates into astronomical returns G+E/P=0.25 +0.033=0.28
which exceed by far the 3.3% justified by the earnings and the 1.4%
payed as dividends.
Finally, note the near collapse of Marconi's share from GBP 800 to 16.75,
which shows that the company has large financial difficulties and may go
bankrupt, i.e. the share value drop to zero forever. This is consistent
with the low credit worthiness perceived for its corporate bond
(1.3#tab.1) and underlines the fact that a high investment risk can
lead to large losses.
Intra-day prices can in general not be accessed free of charge; daily
values adjusted for occasional splits can,
however, be downloaded using the MKTSolution applet
below.
From this overview, it should be clear that a higher return can be expected
if the investor accepts a larger risk. The comming sections describe simple
methods to maximize the return from a portfolio and determine the risk from
historical data.
But how much risk should an investor take anyway? A mountaineer says this a
matter of taste, while common sense tells you not to wake up in the middle
of the night to worry about a portfolio!


 SYLLABUS Previous: 1.2 Capital and markets
Up: 1 INTRODUCTION
Next: 1.4 Modern portfolio theory
SYLLABUS Previous: 1.2 Capital and markets
Up: 1 INTRODUCTION
Next: 1.4 Modern portfolio theory